본 게시글의 원문은 Yann Debray의 MATLAB with Python Book 입니다. 해당 책은 MIT 라이센스를 따르기 때문에 개인적으로 번역하여 재배포 합니다. 본 포스팅에는 추후 유료 수익을 위한 광고가 부착될 수도 있습니다.
MIT License

Copyright (c) 2023 Yann Debray

Permission is hereby granted, free of charge, to any person obtaining a copy
of this software and associated documentation files (the "Software"), to deal
in the Software without restriction, including without limitation the rights
to use, copy, modify, merge, publish, distribute, sublicense, and/or sell
copies of the Software, and to permit persons to whom the Software is
furnished to do so, subject to the following conditions:

The above copyright notice and this permission notice shall be included in all
copies or substantial portions of the Software.

THE SOFTWARE IS PROVIDED "AS IS", WITHOUT WARRANTY OF ANY KIND, EXPRESS OR
IMPLIED, INCLUDING BUT NOT LIMITED TO THE WARRANTIES OF MERCHANTABILITY,
FITNESS FOR A PARTICULAR PURPOSE AND NONINFRINGEMENT. IN NO EVENT SHALL THE
AUTHORS OR COPYRIGHT HOLDERS BE LIABLE FOR ANY CLAIM, DAMAGES OR OTHER
LIABILITY, WHETHER IN AN ACTION OF CONTRACT, TORT OR OTHERWISE, ARISING FROM,
OUT OF OR IN CONNECTION WITH THE SOFTWARE OR THE USE OR OTHER DEALINGS IN THE
SOFTWARE.
본 게시물에서 활용된 소스 코드들은 모두 Yann Debray의 GitHub Repo에서 확인할 수 있습니다.
5.1. MATLAB에서 Scikit-learn 호출하기
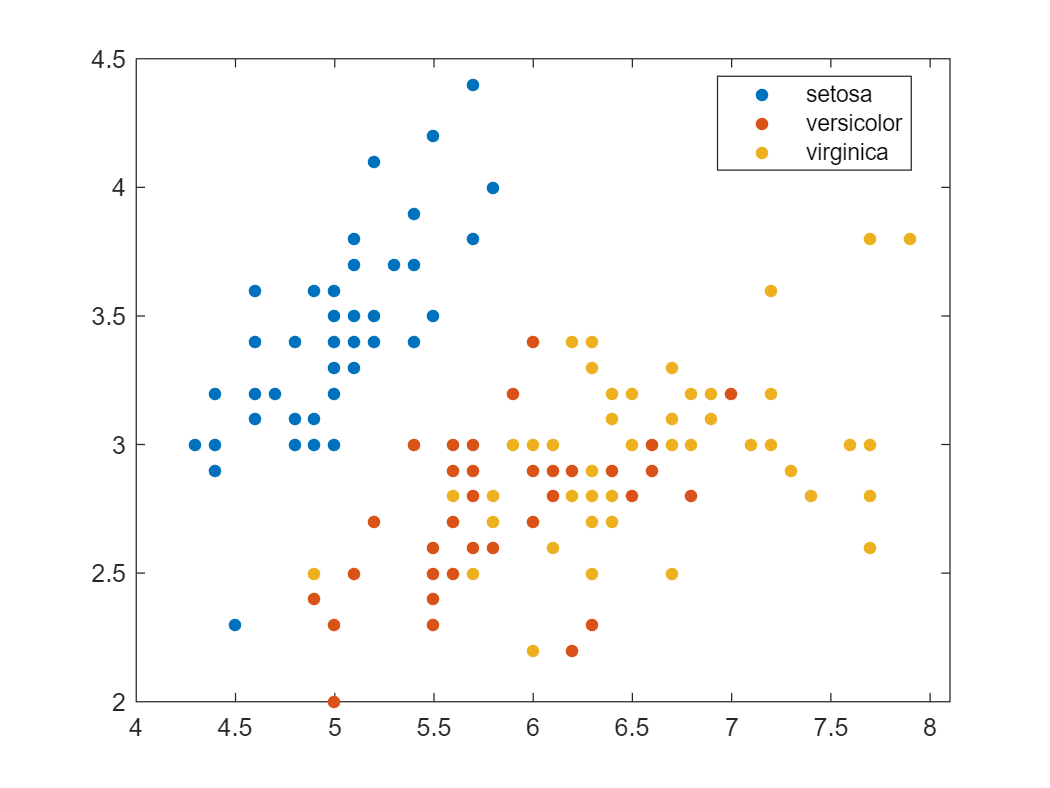
Iris 꽃 데이터셋은 영국 통계학자이자 생물학자인 Ronald Fisher가 소개한 다변량 데이터셋입니다. 이 데이터셋은 3가지 다른 종류의 붓꽃(Setosa, Versicolour 및 Virginica) 꽃잎과 꽃받침 길이로 이루어진 150x4 numpy.ndarray로 구성되어 있습니다. 행은 샘플을 나타내고 열은 꽃받침 길이, 꽃받침 폭, 꽃잎 길이 및 꽃잎 폭을 나타냅니다.
또한 이 데이터셋은 MATLAB에도 있으며, 이는 통계 및 머신 러닝 도구 상자의 일부로 제공되는 샘플 데이터셋 목록에 포함되어 있습니다:
load fisheriris.mat
gscatter(meas(:,1),meas(:,2),species)
또는 Scikit-learn 라이브러리에서 데이터셋을 가져올 수도 있습니다 (아직 MATLAB 내부에서).
iris_dataset = py.sklearn.datasets.load_iris()
iris_dataset =
  Python Bunch with no properties.

    {'data': array([[5.1, 3.5, 1.4, 0.2],
           [4.9, 3. , 1.4, 0.2],
           [4.7, 3.2, 1.3, 0.2],
           [4.6, 3.1, 1.5, 0.2],
           [5. , 3.6, 1.4, 0.2],
           [5.4, 3.9, 1.7, 0.4],
            ...
           [6.2, 3.4, 5.4, 2.3],
           [5.9, 3. , 5.1, 1.8]]),
           'target': array([0, 0, 0, 0, 0, 0, 0, 0, 0, 0, 0, 0, 0, 0, 0, 0, 0, 0, 0, 0, 0, 0,
           0, 0, 0, 0, 0, 0, 0, 0, 0, 0, 0, 0, 0, 0, 0, 0, 0, 0, 0, 0, 0, 0,
           0, 0, 0, 0, 0, 0, 1, 1, 1, 1, 1, 1, 1, 1, 1, 1, 1, 1, 1, 1, 1, 1,
           1, 1, 1, 1, 1, 1, 1, 1, 1, 1, 1, 1, 1, 1, 1, 1, 1, 1, 1, 1, 1, 1,
           1, 1, 1, 1, 1, 1, 1, 1, 1, 1, 1, 1, 2, 2, 2, 2, 2, 2, 2, 2, 2, 2,
           2, 2, 2, 2, 2, 2, 2, 2, 2, 2, 2, 2, 2, 2, 2, 2, 2, 2, 2, 2, 2, 2,
           2, 2, 2, 2, 2, 2, 2, 2, 2, 2, 2, 2, 2, 2, 2, 2, 2, 2]), 'frame': None, 'target_names': array(['setosa', 'versicolor', 'virginica'], dtype='<U10'), 'DESCR': '...', 'feature_names': ['sepal length (cm)', 'sepal width (cm)', 'petal length (cm)', 'petal width (cm)'], 'filename': 'iris.csv', 'data_module': 'sklearn.datasets.data'}
Scikit-learn 데이터셋은 Bunch 객체로 반환됩니다. MATLAB 내부에서 직접 Python 모듈 문서에 액세스할 수 있습니다:
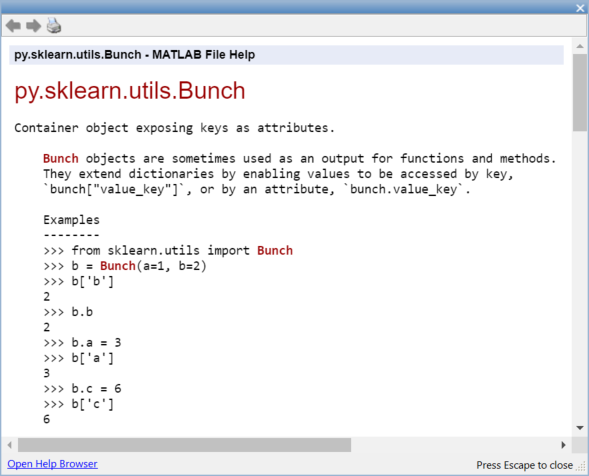
이 데이터셋은 MATLAB로 struct 형태로 전달할 수 있습니다.
struct(iris_dataset)
ans =
             data: [1x1 py.numpy.ndarray]
           target: [1x1 py.numpy.ndarray]
            frame: [1x1 py.NoneType]
     target_names: [1x1 py.numpy.ndarray]
            DESCR: [1x2782 py.str]
    feature_names: [1x4 py.list]
         filename: [1x8 py.str]
      data_module: [1x21 py.str]
X_np = iris_dataset{'data'}
X_np =
  Python ndarray:

    5.1000    3.5000    1.4000    0.2000
    4.9000    3.0000    1.4000    0.2000
    4.7000    3.2000    1.3000    0.2000
    4.6000    3.1000    1.5000    0.2000
    ...
    5.9000    3.0000    5.1000    1.8000

    Use details function to view the properties of the Python object.

    Use double function to convert to a MATLAB array.
X_ml = double(X_np)
X_ml = 150x4
    5.1000    3.5000    1.4000    0.2000
    4.9000    3.0000    1.4000    0.2000
    4.7000    3.2000    1.3000    0.2000
    4.6000    3.1000    1.5000    0.2000
    5.0000    3.6000    1.4000    0.2000
    5.4000    3.9000    1.7000    0.4000
    4.6000    3.4000    1.4000    0.3000
    5.0000    3.4000    1.5000    0.2000
    4.4000    2.9000    1.4000    0.2000
    4.9000    3.1000    1.5000    0.1000
X = X_ml(:,1:2)
X = 150x2
    5.1000    3.5000
    4.9000    3.0000
    4.7000    3.2000
    4.6000    3.1000
    5.0000    3.6000
    5.4000    3.9000
    4.6000    3.4000
    5.0000    3.4000
    4.4000    2.9000
    4.9000    3.1000
y = iris_dataset{'target'}
y =
  Python ndarray:

   0   0   0   0   0   0   0   0   0   0   0   0   0   0   0   0   0   0   0   0   0   0   0   0   0   0   0   0   0   0   0   0   0   0   0   0   0   0   0   0   0   0   0   0   0   0   0   0   0   0   1   1   1   1   1   1   1   1   1   1   1   1   1   1   1   1   1   1   1   1   1   1   1   1   1   1   1   1   1   1   1   1   1   1   1   1   1   1   1   1   1   1   1   1   1   1   1   1   1   1   2   2   2   2   2   2   2   2   2   2   2   2   2   2   2   2   2   2   2   2   2   2   2   2   2   2   2   2   2   2   2   2   2   2   2   2   2   2   2   2   2   2   2   2   2   2   2   2   2   2

    Use details function to view the properties of the Python object.

    Use int64 function to convert to a MATLAB array.
% y_ml = int64(y)
일단 Python의 ndarray를 MATLAB 데이터 형식으로 번역하지는 않겠습니다. 대신 Python의 멋진 기능을 사용하여 서수값의 목록을 범주형 종(species)의 목록으로 번역합니다. 이러한 기능은 pyrun 몇 번의 호출로 MATLAB에서 활용할 수 있습니다.
pyrun('dict = {0: "setosa",1: "versicolor", 2: "virginica"}')
s = pyrun('species = [dict[i] for i in y]','species',y = y) % y를 입력으로 전달하고 종(species)을 출력으로 얻습니다.
s =
  Python list with values:

    ['setosa', 'setosa', 'setosa', 'setosa',
    ...
    'versicolor', 'versicolor', 'versicolor',
    ...
    'virginica', 'virginica', 'virginica']

    Use string, double or cell function to convert to a MATLAB array.
마지막으로, Python 리스트를 MATLAB 범주형 변수로 가져올 수 있습니다:
categoricalSpecies = categorical(cell(s));
이제 categoricalSpecies는 MATLAB에서 사용할 수 있는 범주형 변수가 됩니다.
s = string(s);
species = categorical(s)
species = 1x150 categorical
setosa       setosa       setosa       setosa       setosa       setosa       setosa       setosa       setosa       setosa       setosa       setosa       setosa       setosa       setosa       setosa       setosa       setosa       setosa       setosa       setosa       setosa       setosa       setosa       setosa       setosa       setosa       setosa       setosa       setosa
Python에서 전처리를 수행하는 또 다른 접근 방식은 pyrunfile을 사용하여 수행할 수 있습니다.
[X,y,species] = pyrunfile('iris_data.py',{'Xl','y','species'})
X =
  Python list with values:

    [[5.1, 3.5], [4.9, 3.0],
    ... [5.9, 3.0]]

    Use string, double or cell function to convert to a MATLAB array.

y =
  Python ndarray:

   0   0   0   0   0   0   0   0   0   0   0   0   0   0   0   0   0   0   0   0   0   0   0   0   0   0   0   0   0   0   0   0   0   0   0   0   0   0   0   0   0   0   0   0   0   0   0   0   0   0   1   1   1   1   1   1   1   1   1   1   1   1   1   1   1   1   1   1   1   1   1   1   1   1   1   1   1   1   1   1   1   1   1   1   1   1   1   1   1   1   1   1   1   1   1   1   1   1   1   1   2   2   2   2   2   2   2   2   2   2   2   2   2   2   2   2   2   2   2   2   2   2   2   2   2   2   2   2   2   2   2   2   2   2   2   2   2   2   2   2   2   2   2   2   2   2   2   2   2   2

    Use details function to view the properties of the Python object.

    Use int64 function to convert to a MATLAB array.

species =
  Python list with values:

    ['setosa', 'setosa', 'setosa', 'setosa',
    ...
    'versicolor', 'versicolor', 'versicolor',
    ...
    'virginica', 'virginica', 'virginica']

    Use string, double or cell function to convert to a MATLAB array.
다음은 Python 스크립트의 내용입니다:
iris_data.py
from sklearn import datasets
iris = datasets.load_iris()

X = iris.data[:, :2]  # 처음 두 개의 특성만 사용합니다 (꽃받침)
Xl = X.tolist()
y = iris.target
dict = {0: "setosa", 1: "versicolor", 2: "virginica"}
species = [dict[i] for i in y]
이 경우, 우리는 Numpy 배열 대신 리스트의 리스트를 검색하고 있습니다. 이는 수동 데이터 마샬링이 필요합니다.
Xc = cell(X)'
| 1 | |
|---|---|
| 1 | 1x2 list |
| 2 | 1x2 list |
| 3 | 1x2 list |
| 4 | 1x2 list |
| 5 | 1x2 list |
…
Xc1 = cell(Xc{1})
| 1 | 2 | |
|---|---|---|
| 1 | 5.1000 | 3.5000 |
cell2mat(Xc1)
ans = 1x2
    5.1000    3.5000
이전 단계는 도우미 함수 dataprep에 포함되어 있습니다 (라이브 스크립트의 끝에):
function Xp = dataprep(X)
  Xc = cell(X)';
  Xcc = cellfun(@cell,Xc,'UniformOutput',false);
  Xcm = cellfun(@cell2mat,Xcc,'UniformOutput',false);
  Xp = cell2mat(Xcm);
end
X_ml = dataprep(X);
y_ml = double(y);
s = string(species);
species = categorical(s);
데이터 전송을 포함하지 않는 다른 접근 방식은 Python에서 전처리를 수행하고 결과를 Parquet 파일로 저장하는 것입니다.
pyrunfile('iris_data_save.py')
그런 다음, Parquet 파일을 직접 테이블로 MATLAB에 로드할 수 있습니다.
T = parquetread("iris.parquet")
| lenght | width | species | |
|---|---|---|---|
| 1 | 5.1000 | 3.5000 | “setosa” |
| 2 | 4.9000 | 3 | “setosa” |
| 3 | 4.7000 | 3.2000 | “setosa” |
| 4 | 4.6000 | 3.1000 | “setosa” |
| 5 | 5 | 3.6000 | “setosa” |
| 6 | 5.4000 | 3.9000 | “setosa” |
| 7 | 4.6000 | 3.4000 | “setosa” |
| 8 | 5 | 3.4000 | “setosa” |
| 9 | 4.4000 | 2.9000 | “setosa” |
| 10 | 4.9000 | 3.1000 | “setosa” |
| 11 | 5.4000 | 3.7000 | “setosa” |
| 12 | 4.8000 | 3.4000 | “setosa” |
| 13 | 4.8000 | 3 | “setosa” |
| 14 | 4.3000 | 3 | “setosa” |
Scikit-Learn의 Logistic Regression 모델 및 그의 fit 및 predict 메서드를 직접 호출할 수 있습니다.
model = py.sklearn.linear_model.LogisticRegression();
model = model.fit(X,y); % 객체 참조를 통해 전달
y2 = model.predict(X);
y2_ml = double(y2);
confusionchart(y_ml,y2_ml)
이제 Scikit-Learn 모델을 래퍼 모듈을 통해 호출할 수 있습니다.
model = py.iris_model.train(X,y);
y2 = py.iris_model.predict(model, X)
y2 =
  Python ndarray:

   0   0   0   0   0   0   0   0   0   0   0   0   0   0   0   0   0   0   0   0   0   0   0   0   0   0   0   0   0   0   0   0   0   0   0   0   0   0   0   0   0   0   0   0   0   0   0   0   0   0   2   2   2   1   2   1   2   1   2   1   1   1   1   1   1   2   1   1   1   1   1   1   1   1   2   2   2   2   1   1   1   1   1   1   1   2   2   1   1   1   1   1   1   1   1   1   1   1   1   1   2   1   2   2   2   2   1   2   2   2   2   2   2   1   1   2   2   2   2   1   2   1   2   1   2   2   1   1   2   2   2   2   2   2   1   2   2   2   1   2   2   2   1   2   2   2   1   2   2   1

    Use details function to view the properties of the Python object.

    Use int64 function to convert to a MATLAB array.
학습 세트를 기반으로 한 모델의 정밀도:
sum(y_ml == y2)/length(y_ml)
ans = 0.8200
또는 MATLAB에서 다양한 분류 모델을 훈련할 수도 있습니다. 다양한 머신러닝 방법에 대해 익숙하지 않다면 앱을 사용하여 다양한 유형의 모델 결과를 간단히 시도해볼 수 있습니다:
classificationLearner(X_ml,species)
이를 통해 모델의 결과를 쉽게 시각화하고 평가할 수 있습니다.